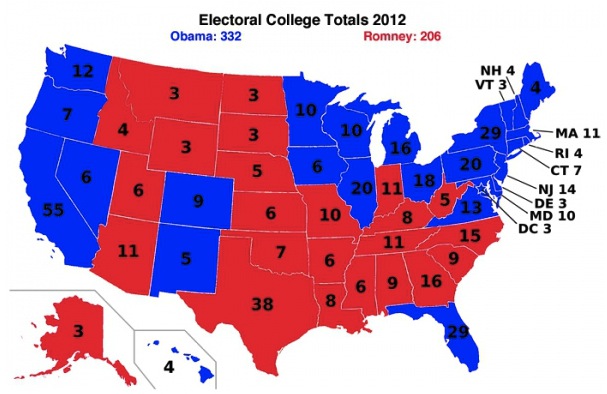
Of the 10 states with the lowest GDP per capita, 8 of them voted Republican in the 2012 presidential campaign. Similarly, of the 10 highest GDP per capita states, 8 of them voted Democratic.
Interpret how you please, but to me it says that GOP policies do not work for the average American. Furthermore, it appears that voters in the poorest states tend to vote against their own interests. Here is the data:
| State |
2010 GDP
per capita
|
2012
Blue/Red
|
| Mississippi | $32,967 | Red |
| Idaho | $34,250 | Red |
| West Virginia | $35,053 | Red |
| South Carolina | $35,717 | Red |
| New Mexico | $35,952 | Blue |
| Alabama | $36,333 | Red |
| Arkansas | $36,483 | Red |
| Montana | $37,200 | Red |
| Kentucky | $37,535 | Red |
| Michigan | $37,616 | Blue |
| Tennessee | $39,730 | Red |
| Florida | $40,106 | Blue |
| Maine | $40,923 | Blue |
| Missouri | $41,117 | Red |
| Indiana | $41,169 | Red |
| Georgia | $41,711 | Red |
| Utah | $41,750 | Red |
| Ohio | $42,035 | Blue |
| Oklahoma | $42,237 | Red |
| North Carolina | $42,884 | Red |
| Vermont | $44,000 | Blue |
| Wisconsin | $44,105 | Blue |
| Kansas | $44,310 | Red |
| Oregon | $44,447 | Blue |
| Rhode Island | $45,000 | Blue |
| Pennsylvania | $45,323 | Blue |
| Texas | $45,940 | Red |
| Nevada | $47,222 | Blue |
| New Hampshire | $47,385 | Blue |
| Louisiana | $47,467 | Red |
| North Dakota | $47,714 | Red |
| Iowa | $49,067 | Blue |
| Hawaii | $49,214 | Blue |
| Nebraska | $49,778 | Red |
| South Dakota | $49,875 | Red |
| Illinois | $50,328 | Blue |
| Minnesota | $50,396 | Blue |
| Maryland | $51,724 | Blue |
| California | $51,914 | Blue |
| Colorado | $51,940 | Blue |
| Washington | $52,403 | Blue |
| Virginia | $53,463 | Blue |
| New Jersey | $56,477 | Blue |
| New York | $57,423 | Blue |
| Massachusetts | $58,108 | Blue |
| Wyoming | $63,667 | Red |
| Connecticut | $64,833 | Blue |
| Alaska | $65,143 | Red |
| Delaware | $69,667 | Blue |
| D. C. | $174,500 | Blue |


